Capstone Project: Developing a next generation system to measure and control fruit fly behaviour
Quick Description
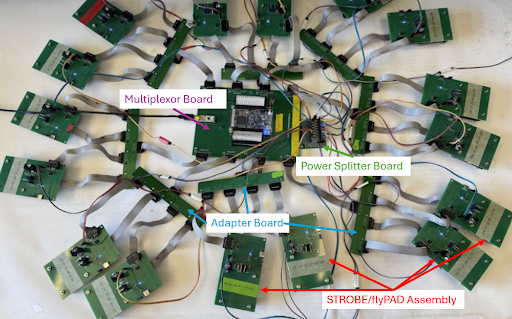
Gordon Lab is dedicated to understanding and exploring the neuroscience of animal feeding behaviors, focusing on Drosophila melanogaster (fruit flies) due to their small size, short lifespan, and simple neural systems. They developed the Fly Proboscis and Activity Detector (flyPAD) to track fruit fly interactions with food and paired it with the Sip-Triggered Optogenetic Behavior Enclosure (STROBE) to manipulate neural activity. Using light, they can manipulate how fruit flies perceive the food that they eat, and make them like undesirable food, or hate delicious food like sugar. This is done by triggering the light when the fruit flight interacts with the food via a capacitive sensor: the fly sits on the sensor to eat the food, a capacitive signal is generated, and the main FPGA board sends a signal to the STROBE to turn on the corresponding LED light.
For this project, I led the complete redesign for their STROBE system - scrapping the old, single MOSFET switch circuit for a controllable, variable LED driver that can vary both the power output of the LED, and the flashing frequency. I also designed scalable RTOS firmware to control the new STROBE module and allow for the future expansion to accomodate more LEDs. Lastly, I designed a control system that would autonomously search for the optimal light intensity and flashing frequency that would cause the fruit flies to consume the most amount of food.
Designing a Constant-Current Controlled LED Driver
The client desired the ability to control the brightness of the LEDs in order to vary the impact on the neurons of the flies, and also wanted to experiment having the LEDs flash at different frequencies to determine if that had an impact on the fruit flies.
Given these requirements, an adjustable constant current driver was the best solution. It would be able to regulate the current through the LEDs and produce a constant brightness. The most straightforward choice was to use a MOSFET switching circuit, but unlike the old STROBE, it would have a varying input signal instead of just 0V and +3.3V. When saturated, the transistor would act like a constant current source with a current proportional to the gate voltage applied.
Multiple circuits were designed, and the one that performed best under prototype used a DAC in order to allow us to control the voltage through the circuit with a digital signal from a microcontroller. The DAC output is sent to an amplifier, and the amplifier acts like a control system and ensures that the voltage across the resistor (which directly corresponds to the current through the LED) matches the DAC output.
The product went from this scrappy prototype…
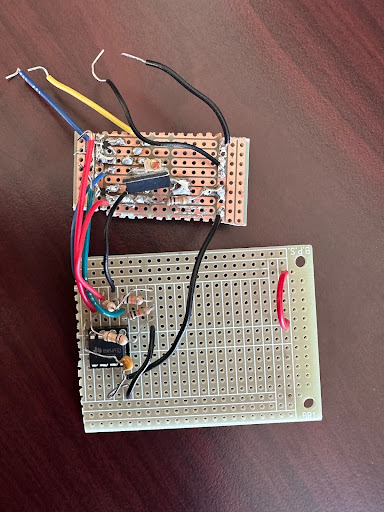
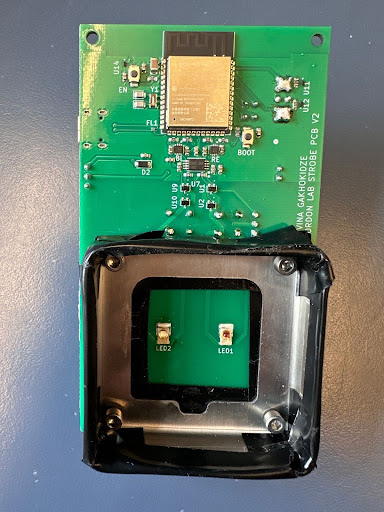
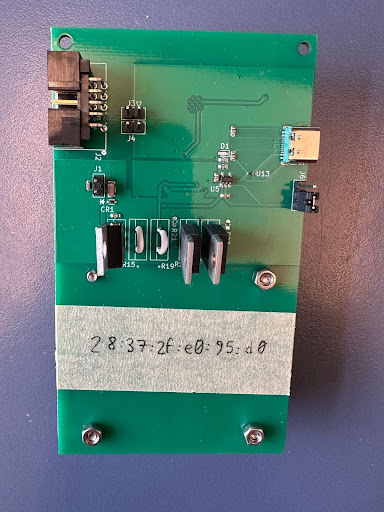
To this beautiful PCB: To see it flash click here and to see the power vary click here
Designing RTOS Firmware for a Scalable LED Driver
To control the LEDs, C++ firmware was developed for the ESP32. With the firmware, the ESP32 controls the DAC and the rest of the circuit hardware reacts accordingly to turn on and flash the LEDs.
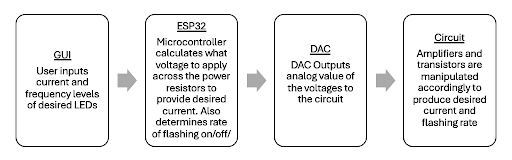
The image below summarizes the general flow of STROBE operation. The microcontroller on the STROBE board wirelessly receives a signal from the broadcast controller, then sends signals to the DAC to turn on/off the LED at the requested frequency and power. The rest of the circuit ensures the current is controlled and precise.
The firmware uses freeRTOS - a real-time operating system kernel that enables multi-tasking. Multi-tasking allows for the controller to switch between functions quickly, creating the illusion of different code running in parallel - i.e., using the principle of concurrency. Using concurrency instead of sequential programming allows both LEDs to be controlled seamlessly without delay - this is crucial because the client wants to minimize the delay in toggling the LEDs when the flies are eating.
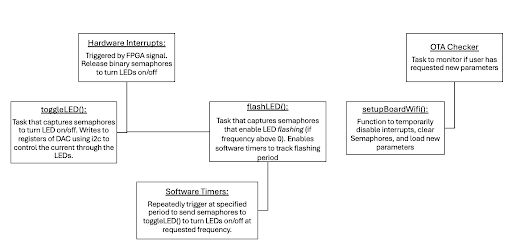
The following figure summarizes the main components in the firmware used to control the STROBE:
The firmware is open source and can be found here: [https://github.com/alvina-gakhokidze/STROBE_firmware]
Designing a Control System
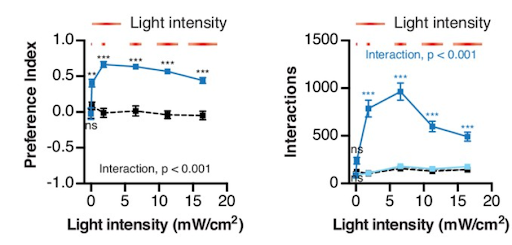
Given past research that has been done by Gordon Lab, we can see that the relationship between input power and the cumulative bites taken by the flies in response to the optogenetic manipulation is not linear:
The objective of the control system is to find the optimal lighting intensity and flashing frequency that maximizes how much the fruit flies eat, for the condition that uses light to make fruit flies like undesirable food.
Given that the system isn’t linear, that it dynamically changes as the experiment progresses (due to the fruit flies gradually being impacted by the stimulation, and also their hunger levels changing, food evaporating, etc), and that the objective is to maximize their consumption, a standard PID controller does not make sense for this application. Instaed, an extremum-seeking controller would be a better fit!
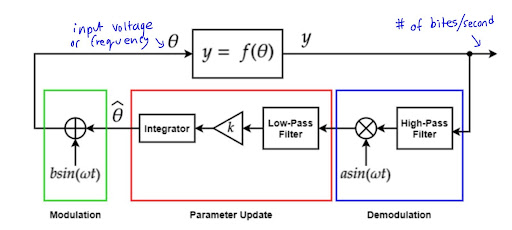
The image above shows the general structure of an extremum seeking controller
This controller is similar to the newtonian-search method, where there is a “base” point of interest. The three main characteristics of this system are:
- Modulation Value: To search for a peak value, we check above and below the point to see which direction to continue in (i.e. continue increasing or decreasing) to maximize our value of interest - this is done by the modulation module which perturbs the input signal to the system.
- Base Value: The value around which we check which direction to continue in is decided by the demodulation and parameter update modules.
- Step Size: The demodulater and integrator allow for the step size of this search method to automatically adjust and become more precise as the maximum value is approached.
To develop accurate parameters for the ESC and to be able to execute the controller in firmware, we need to make the data that the flyPAD system collects usable, and also determine our perturbation signal length. The flyPAD tells us what food the fruit fly is eating, and an estimate of the volume consumed. Data was provided for past experiments, and for the initial design we focused on stimulating the neuron that results in “extreme feeding behaviour.” This is because the impact of this stimulation was the most obvious and observable in the fruit fly (resulting in up to 7000 bites in one experiment).
- Filtering Data It was necessary to apply a filter to the data first, otherwise any approximations of LTI manipulations would be too noisy. A good way to judge the smoothness of this data was to aim for a smooth derivative, which resembles an under-damped second-order step response when filtered properly.
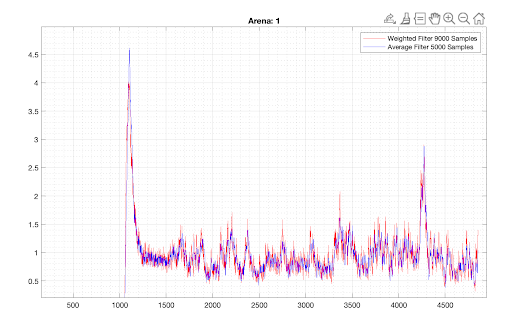
A moving average filter was first created to determine a baseline “smoothness” that was acceptable, and then a weighted design filter was created to match that same smoothness. The advantage of the weighted filter was that the average age of the data wa a lot smaller when using the same number of samples. However, after modelling, it turned out that for the weighted sum filter’s smoothing effect to match the moving average filter, a lot more samples have to be used, as shown in the following table:
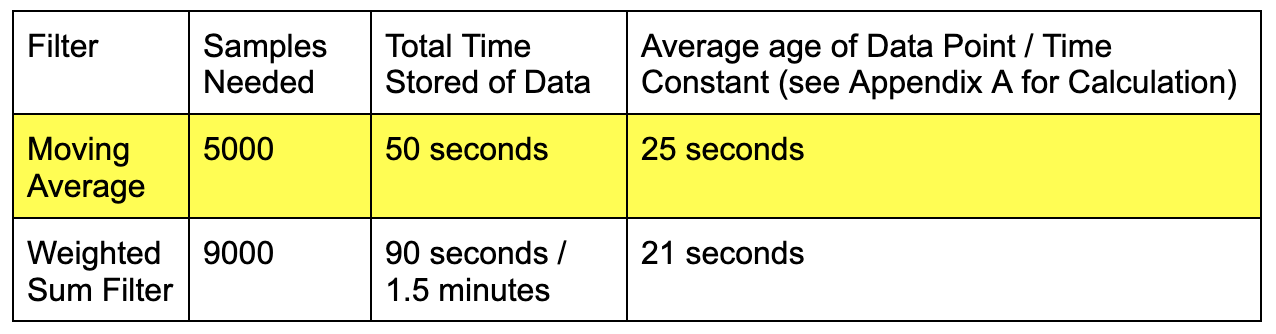
The memory cost of storing 80% more samples for only a 4 second reduction in delay was not effective. A similar effect could be created by slightly reducing the samples of the moving average filter. Therefore, it was best to use the moving average filter.
Lastly, I measured the average period between fruit fly bites to determine how long the perturbation signal needs to be. Developing histograms of the experiments showed us that the fruit flies interacted with the food approximately every 0-3 seconds.
Next, we needed to determine how long it took for fruit fly behaviour to react to optogenetic experiments. This was done by looking at the rate at which they bite - the bites/second, and in the below image we can see that the step response has a similar shape to a 2nd order step response. Thus, we were able to measure rise/peak/settle time to see how long it took for the fruit flies to react.
The times were measured for all eight experiments provided by the client, and the values were averaged:
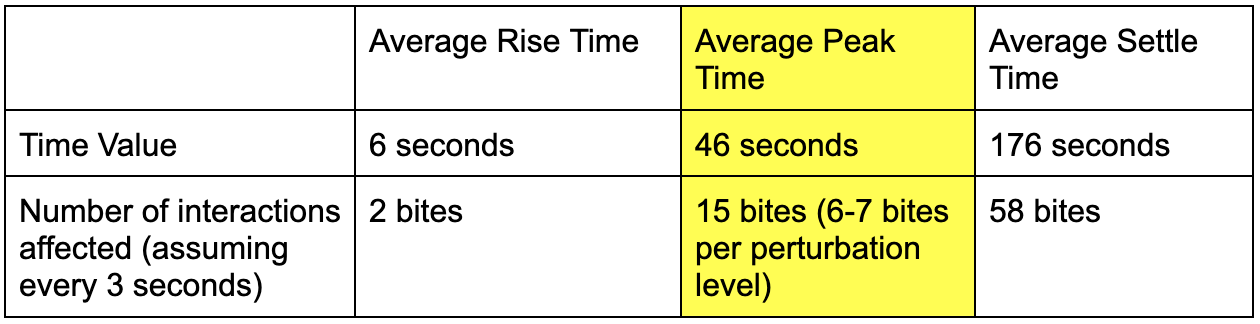
We could use peak time as the starting period of our perturbation signal.
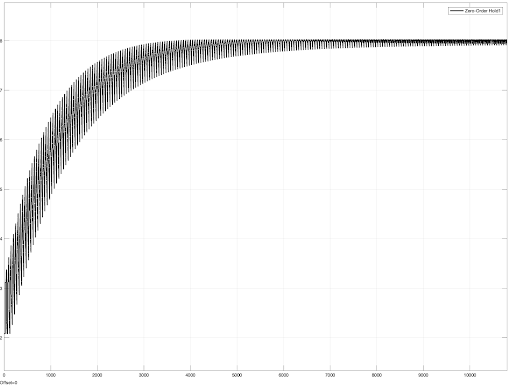
The following figure shows a simulated response of the extremum-seeking controller when searching for the maximum of a parabola (which is a rough approximation of the data from the very first image provided by Gordon Lab). The controller can accurately find the peak power within +- 0.2W.
Take a look at the STROBE firmware to see how this control system was implemented.
It takes 2-3 hours for the control system to find the peak conditions. Unfortunately, the experiments can realistically only last about 1 hour, because the food source will evaporate (even in a humidity chamber). Therefore, it is not currently realistic to put this control system to use. Even after extensive parameter tuning and experimentation, there was no way to bring the simulation time down - it may require intervention on the side of the hardware, the food source, or the humidity chamber to extend the possible testing time. Currently, the feature is disabled in the firmware.